Cold Chain Logistics: Management Challenges & Solutions
The supply chain is a term used to describe all the components required to transport goods from beginning to end, from production to the end...
7 min read
 BUKU Marketing
:
Jun 7, 2023 1:11:51 PM
In business, by paying attention to data and statistics you can increase knowledge and make future decision-making more accurate. This shouldn’t be any different when it comes to eCommerce. But with so much data available how are you able to compile, understand and utilize the data available to you? This is where picking the correct tool is important.
Table of Contents
Everything you would want to know or learn is out there. But, the data is all scattered and disorganized. The first step in using this data is to gather as much of it as you can. BUKU's newest feature, BuKuTrak is an incredibly useful tool to help any eCommerce brand or fulfillment center keep track of shipments.
Make educated future decisions and eliminate friction in the shipping process with BuKuTrak.
How to make data-driven decisions?
The best decisions are well informed decisions. Using data in your decision making process is more effective and helps you make smarter decisions. In order to do this you need to follow a set of steps. They are:
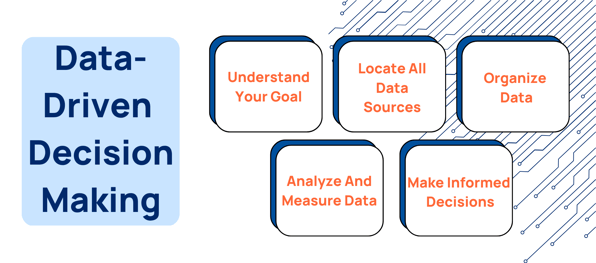 Understand your goal
When looking to make an informed decision you need to understand for what purpose this decision is going to be made. Ask yourself, what am I solving? What is my purpose behind what I'm doing?
Once you know the goal behind your decisions you make more focused and intelligent decisions to accomplish your goal.
“Our goals can only be reached through a vehicle of a plan, in which we must fervently believe, and upon which we must vigorously act. There is no other route to success.” - Pablo Picasso
Locate all data sources
The next step is gathering all possible data. The more data the better. If you want to make an accurate decision you need to go to multiple sources.
Organize data
Once all of the data is gathered into one location you need to clean and organize the data. Disorganized data is not helpful to anyone and can lead to inaccurate decisions. Cleaning data takes time and effort. But, once it's done the data is in a perfect place to be utilized.
Analyze and measure data
Now comes the fun part! Analyzing and measuring the data present to you. Use graphs, filters, and other functions to help you understand the data you are working with to interpret it.
Make informed decisions
Now that all the data has been compiled and analyzed think back to your goal. What question were we trying to solve? An example could be, I want to make sure my shipments arrive on time to improve customer experience. That is a great goal. How can this be accomplished and how can I use data in my search to achieve my goal.
Use tools and data available to you. For this example BuKuTrak would be a perfect solution. You can easily compile all shipping data into one dashboard. The dashboard helps you analyze your data and see where the frictions and pain points occur as the product makes its way to the customer. Once you have the knowledge gained from the data you have collected and analyzed, you can then make the most informed decision for you brand/fulfillment center.
Difference between proactive and customer facing tracking
There is a major difference between proactive and customer facing tracking. Both are extremely useful and have different benefits.
Customer facing –
This tracking feature is for the customer wanting to receive updates on the status of their package. This is a page where they can track the progress of their packages as it makes their way to them in order to give them peace of mind and transparency.
Proactive tracking –
This is what BuKuTrak is. It’s designed for brand and fulfillment use. It allows the user to view, analyzed and monitor all shipping data in a single dashboard. It’s equipped with various filter and drill through functions that give the user the ability to see specific shipping data.
Instead of having a reactionary response be proactive with tracking. This software was designed to give the brand/fulfillment center the most accurate data to make informed decisions. And the result of using a solution like BuKuTrak is increase effectiveness, knowledge, and improved customer experience.
What is BuKuTrak?
BuKuTrak is BUKU’s newest proactive tracking solution. With this solution brands and fulfillment centers have a one stop dashboard for all things delivery. From purchase to arrival keep an eye on your shipments. Use the intel gained with BuKuTrak to better understand your shipping process and ensure packages arrive on time.
With IntelliRate track the status of up to 15 key events (first scan, picked up, arrived at customs, out for delivery, etc.)
This new solution is easy to use, intuitive, and highly effective. Any brand wanting to utilize data to their advantage needs BuKuTrak. This not only improves effectiveness, understanding and lowers possible pain points. It also can improve the customer experience.
What does BuKuTrak look like? Here are some screenshots from the dashboard.
Shipping Summary
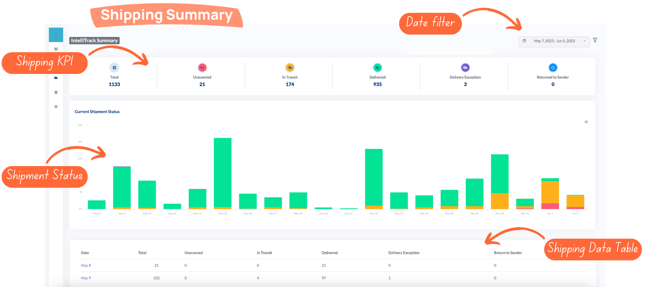
This is the main dashboard that you will first see upon arrival. It gives you an overall "Shipping Summary" of all things tracking. Starting at the top you see a list of KPIs (Key Performance Indicators). These KPIs include: Total, Unscanned, In Transit, Delivered, Delivery Exception and Return to Sender. These metrics are the most important to monitor and can help your brand evaluate shipping efficiency. In the top right section there is a "Date Filter". With this filter you have the option to view data for: Today, Yesterday, Last 7 days, 30 days, This month, Last month, This quarter, Last quarter and a Custom filter.
Below the KPIs there is a graph showing the "Current Shipment Status". This gives you an overview for each day and what the overall status looks like for each shipment on that day. This is a graph provides brands with an easy way to visualize daily shipment status.
The bottom section of the dashboard is a table breaking down each day and what each KPI for that specific day. For example we see in this table that on May 9th there was a total of 102, 0 unscanned, 4 in transit, 97 delivered, 1 delivery exception and 0 return to sender. This table gives you the data from the graph above.
Daily Overview
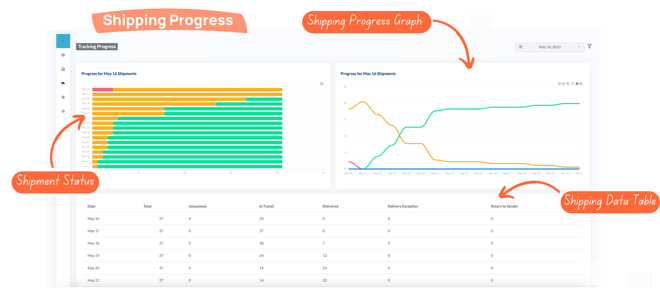
The daily overview gives you the best breakdown of your day to day shipping information. On the left we have a graph displaying the "Progress for (Date) Shipments". Each day is shown and is broken down into 3 colors. As you hover over the red it is "Unscanned". And it shows that just under 10 were unscanned on that date. Yellow represents "In Transit". And green is "Delivered".
On the right hand there is another graph allowing you to visualize a single days shipping progress. The colors follow the same meaning as the previous graph. The goal of your brand with this graph is to make all red and yellow lines go down and for the green line to rise as soon as possible. This shows that the packages are being delivered fast and aren't being delayed.
The bottom section is another table. This table is the same as the one on the main dashboard. It gives you all of the shipping KPI data for each individual day. So if there is any confusion from the graphs it is a great place to look for additional information.
Order Level Data
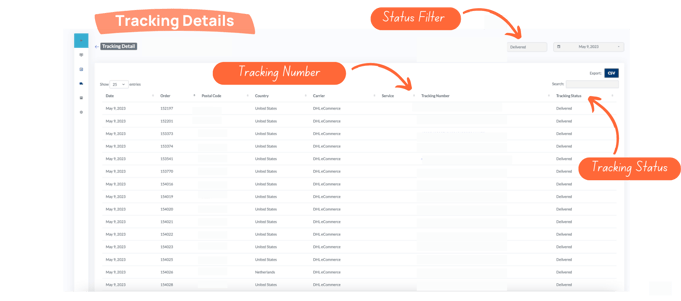
This page shows a breakdown of all tracking details. We have seen that customer service teams love this page because you are able to search for specific tracking numbers. When viewing this page you can see shipping information for each date. You're able to view: Order Number, Postal Code, Country, Carrier, Service, Tracking Number and Tracking Status.
On the top right section of the page you have various filter options. The first box allows you to filter for: All, Unscanned, In Transit, Delivered, Delivery Exception and Returned to Sender. And the second button allows you to filter for each individual date.
This page is also where you will be able to see a more in depth view of where exactly the package is. By clicking on a tracking number a pop-up appears to give you additional carrier information. See here
How does tracking improve the customer experience?
With BuKuTrak you are able to assure your brand or fulfillment center that the customers are getting the best overall experience possible. A major factor in customer satisfaction is in delivery time. Speeding up pick and pack times as well as delivery improves the customer experience. When something is delayed during fulfillment or in delivery you want to be aware of these things.
BuKuTrak allows you to monitor and analyze all shipping data available to you.
Carrier Accountability
With BuKuTrak you gain access to many time and money saving features. One of these features is the ability to view all carrier data in a single dashboard. Instead of going from carrier to carrier trying to find accurate data simply use BuKuTrak to see all information compiled in an easy-to-understand dashboard.
Keeping your carriers accountable is important. They have millions of packages to deal with and packages will end up delayed or even worse, lost. This isn’t a question if it will happen. It’s a question of when it will happen. By using our tracking solution easily recognize a lost or delayed packages and act accordingly to get it back on track or alert the customer. This solution allows you to be proactive and monitor shipments. The second something looks off you are able to respond and solve the problem at hand.
With BuKuTrak you can click on each tracking number to see additional information regarding the shipment. Once you click on the tracking number you're able to see each check point the package goes through. From fulfillment, arriving at sorting facilities, post office, etc. Not only can you see this but you can also see date and time exactly when it occurred. This gives you the most accurate information for shipping all on one live dashboard.
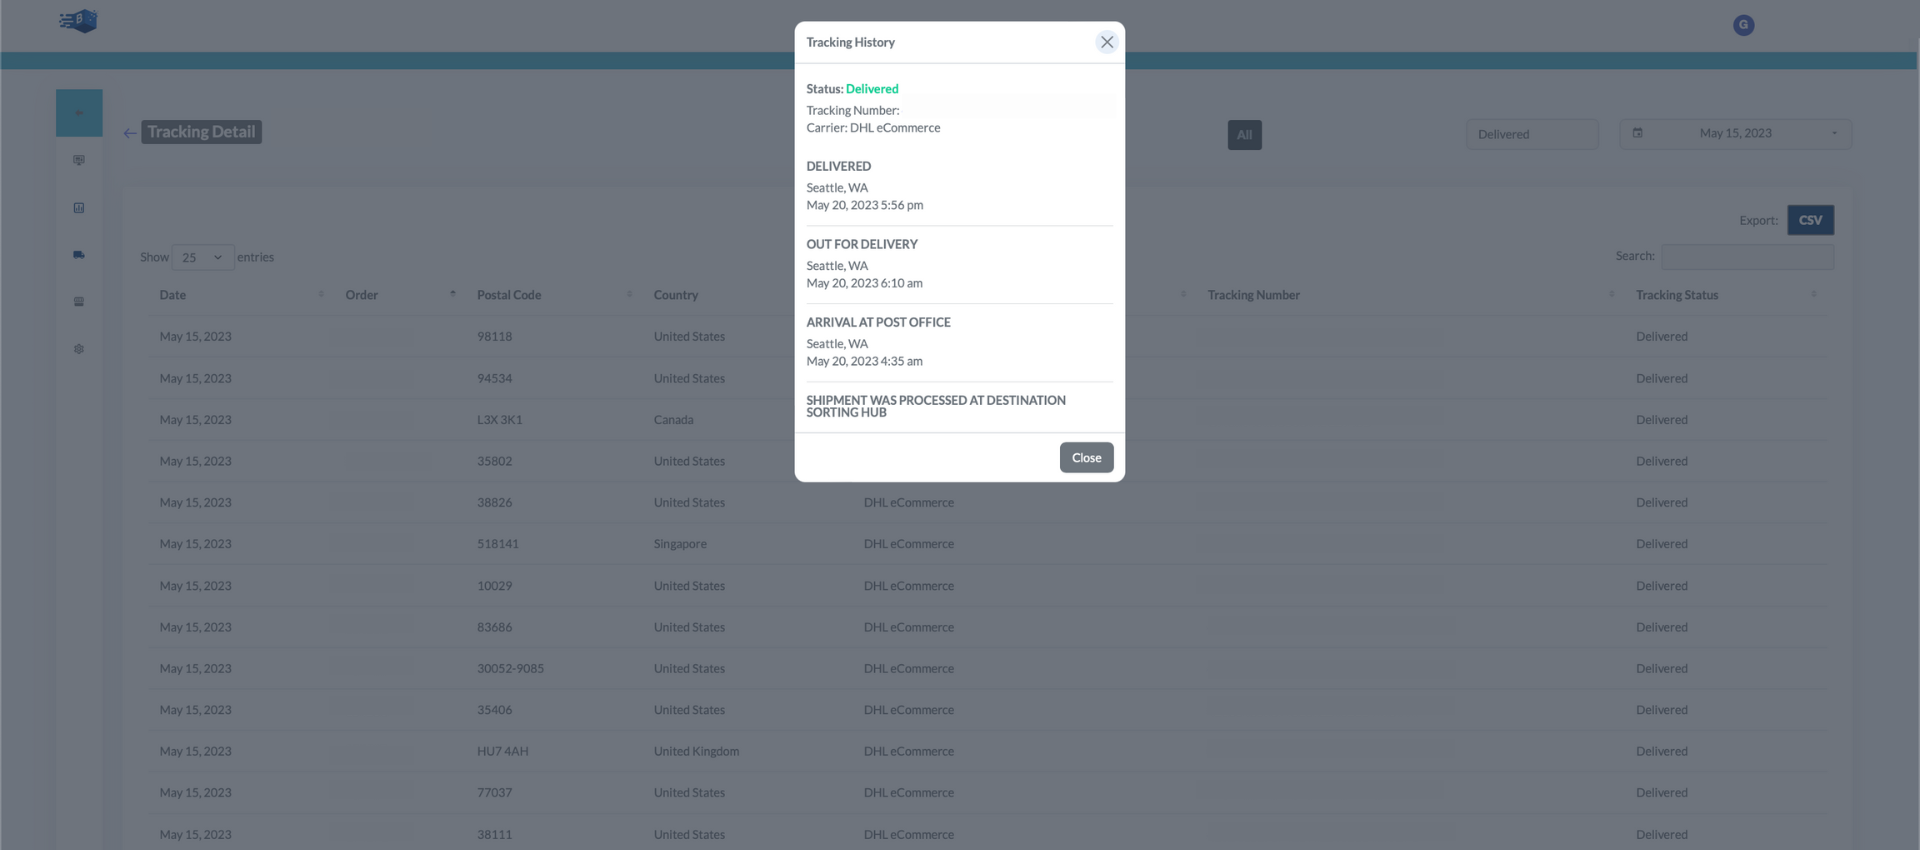
Wanting to dive further? Once you click on the tracking number and the screen above appears, you can click on the number to take you directly to the carrier page. Many times you will see a shipment that only the carrier can fix. Instead of going between carrier webpage and your site you can go directly to the right page straight from the BuKuTrak dashboard.
Do you need order details? This section also allows you to dive into these details with a single click! The dashboard is designed to be your source of truth for all things shipping. No more needing to visit other sites to resolve issues. Get all of your data, information and analytics on one easy to use dashboard.
Final thoughts
Being able to track your shipments is extremely useful for any brand or fulfillment center. It helps you:
There are countless reasons to use BuKuTrak with your brand or fulfillment center. It is easy to use and available today! Making intelligent, data-driven decisions can be impossible without the right tool. BuKuTrak is the right tool for anyone wanting to take a proactive approach to shipping.
Get started today
Getting started with BuKuTrak is easy with BUKU. Schedule a demo with one of our shipping experts and they can get you set up! BUKU works with any size of business so no one is too big or too small for BuKuTrak to handle. We'd love to show you what it can do and how it can transform your business.

The supply chain is a term used to describe all the components required to transport goods from beginning to end, from production to the end...

A smart warehouse is a large building where raw materials and other consumer goods are stored using machines, computers, comprehensive software, and...

Direct-to-consumer (DTC) fulfillment is a strategy that helps brands sell and deliver their products directly to customers more efficiently while...