

 BUKU Marketing
Cold Chain Logistics: Management Challenges & Solutions
The supply chain is a term used to describe all the components required to transport goods from beginning to end, from production to the end...
Want to best optimize your business performance? Start monitoring your shipping analytics. By measuring performance, you give way to growth and efficiency. Many brands are losing thousands of dollars shipping and not doing anything about it. You may have asked yourself the following questions.
Shipping analytics is the interpretation, communication, or visualization of patterns of data related to shipping. Analytics give us insights into significant data regarding a brands shipping.
You need shipping analytics because shipping is a major component in the purchase and customer experience process. To leave shipping untouched will cause brands to lose thousands. Shipping analytics allows you to make strategic shipping decisions to increase cart conversion, demand, and meet customer experience expectations.
By implementing BUKU’s IntelliRate software you can easily see live shipping data to better accomplish your shipping goals and make informed calculated adjustments. Our shipping analytics dashboard gives great insight into customer behavior, areas where you are losing money, and the overall effectiveness of your shipping mechanics.
In this article we will show you how to maximize the IntelliRate Dashboard to not only analyze shipping information but create a profit center by using tools such as cart psychology, rate management, and international compliance assistance. This post is a guide to our dashboard, its features, and what is to come. Using a dashboard to analyze your shipping data is a great way to understand what you’re doing right and wrong. Enable your brand to make the correct decisions today to benefit your business tomorrow.
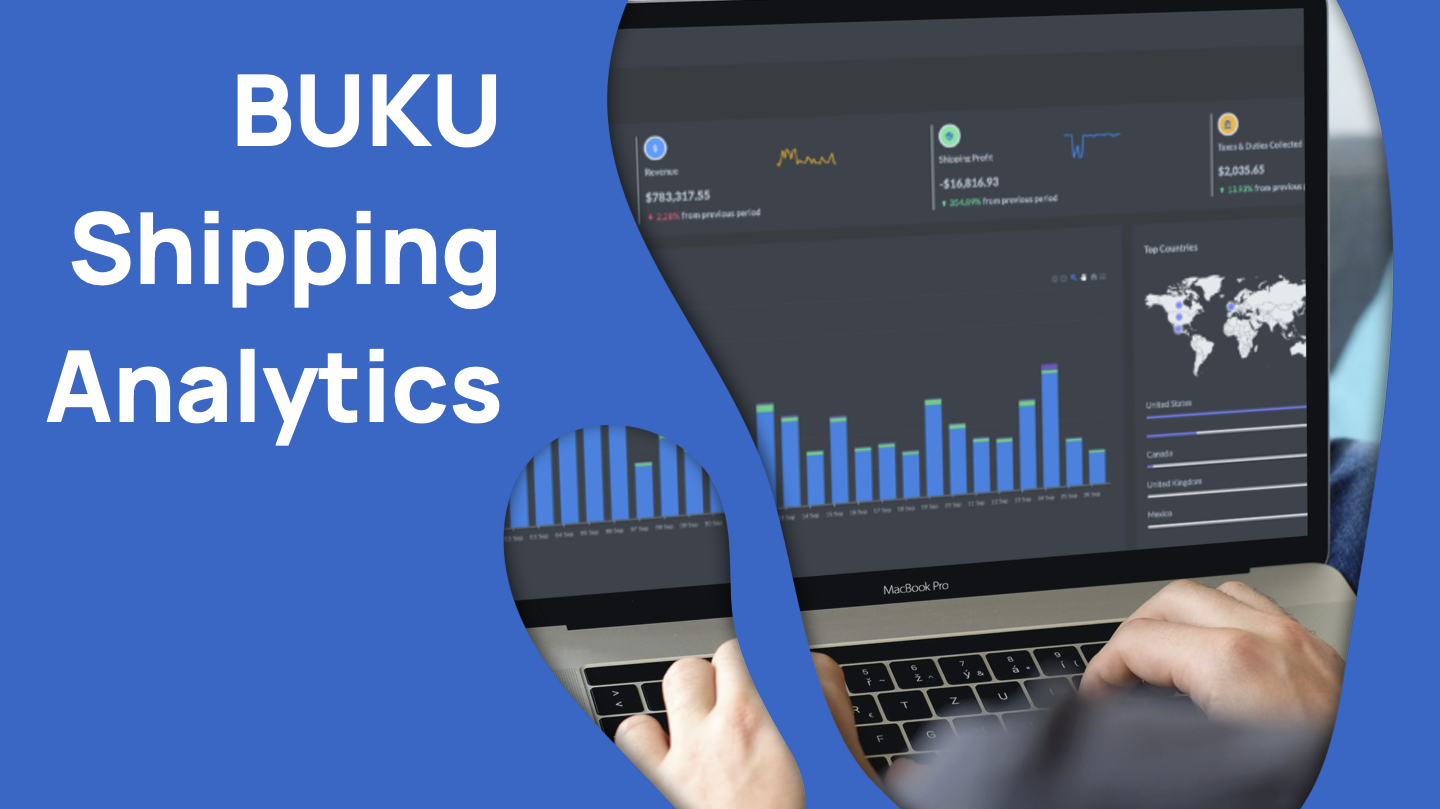
After logging ingo IntelliRate, BUKU's Shopify app, this is the initial dashboard you arrive at.
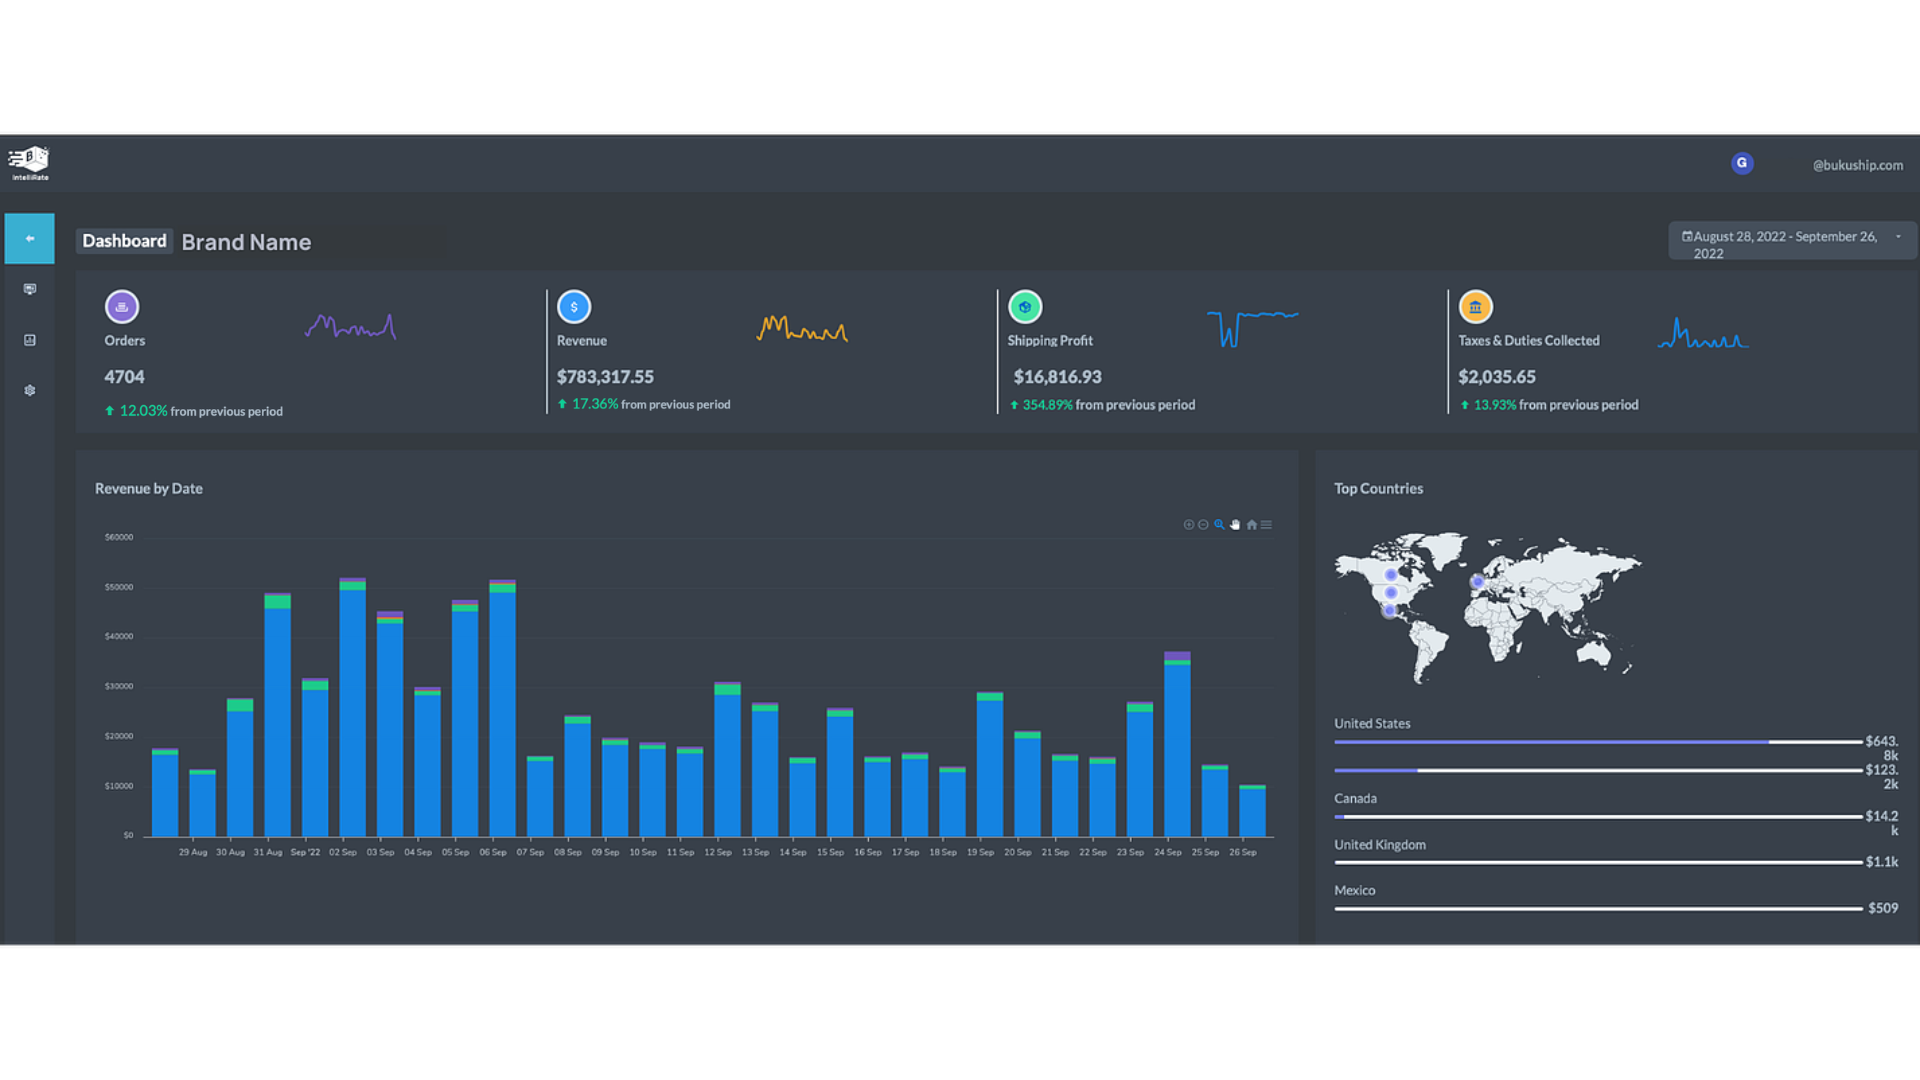
The Main Dashboard provides a complete overview of your brands shipping data. The four top KPI (Key Performance Indicator) columns can be viewed at the top of the Main Dashboard - they are:
These first four columns are important KPIs that your brand can easily be track and to give you key insight into the overall health of your company and shipping efficiencies.
Below each KPI total there is a percentage comparison from the previous period.
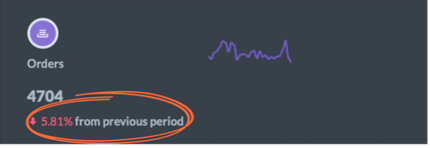
Select any indicator to access additional information for every shipment.
Being able to drill into each of the KPIs is incredibly useful to be able to see specifics for every order.
A KPI, or key performance indicator, is any metric that helps you keep track of your overall performance. Every business needs a few solid metrics to measure and analyze and they complete their business practice. This helps to maintain a healthy and efficient business.
These KPIs are all related closely with shipping and measuring its success. Shipping and sales are closely related so revenue and orders connect that way. Shipping internationally comes with taxes and duties that can be calculated ahead of time. And shipping profit gives you the ability to see how shipping is impacting your business. If its bringing you extra money in or if it's losing you money.
Each of the indicators have drill-down results the following sections will go into detail on each of these KPIs.
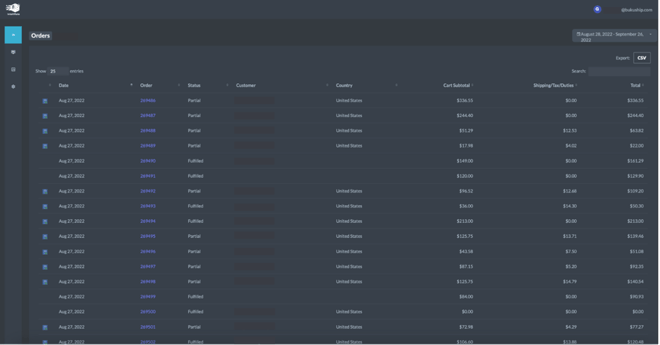
Once selected each of the pages look something like this. This detailed breakdown of your orders allows you to deep dive into individual parcels and better understand your fulfillment.
Shipping profit is a huge metric for BUKU and the brands that we work with. This is one area where you will surely see the impact of the IntelliRate software. Brands spend thousands on shipping and in many cases get nothing in return. Ecommerce shipping is a complicated industry that often causes brands to lose thousands of dollars every month.
Shipping Profit data available:
With IntelliRate we can turn that shipping loss into a profit center. This is all possible by using cart psychology, rate management, and our international assistance. Brands have gone from losing thousands to earning thousands in profit. Which can then be reinvested in the company to provide the highest customer experience possible. As your BUKU journey begins keep an eye out for this metric to see how much you’re earning.
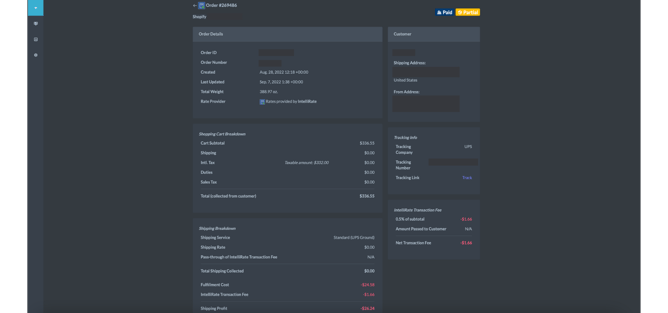
Once you select a KPI you can drill down further into each of the orders by selecting the order number.
The data provided gives insights into each order. It gives you all the specifics for each order containing additional information such as:
All this information is valuable for anyone wanting to locate a specific purchase and have all order information in one place.
The next section you can access directly from the KPIs on the Main Dashboard is the revenue graph breakdown.
Revenue Graph data displayed:
This graph shows revenue by date, which can be extended or magnified with the controls on the top right. You can also export this graph by selecting the three lines on the right-hand corner. It can be exported as a SVG, PNG, or CSV.
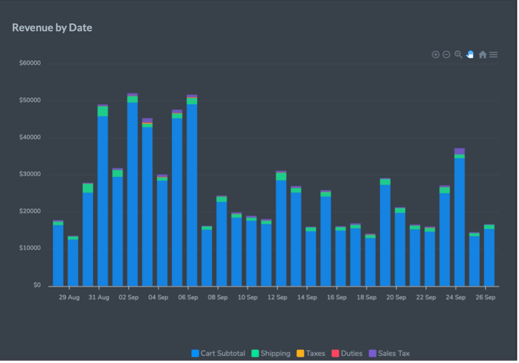
By hovering your mouse over the graph, it also displays cart subtotal (Blue), shipping (Green), sales tax (Purple), and duties (Red).
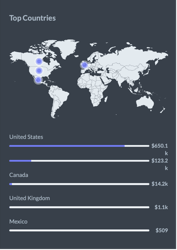 This section of the dashboard displays sales by country. As your brand grows, so will your international presence. Keep track of all revenue source locations with this map.
From the Main Dashboard you will see the top countries purchasing your products. With the date filter you are able to view historical data better than ever before. Not just on this metric but throughout the dashboard.
Click on the map to see an in-depth breakdown of each country you’re shipping to. The data available on this window includes:
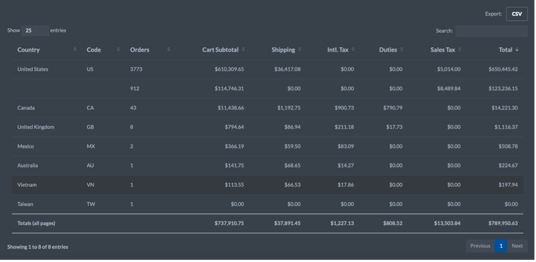
Entering the international market can be difficult. Being able to keep track of international taxes and duties is necessary for legal compliance. BUKU allows you to monitor this key metric. Drilling down further allows you to see the following data:
BUKU will enable you to proactively monitor shipping progress and track against your projected delivery dates. Keep customers happy by updating arrivals times and increase efficiency with priority packing systems.
Provide instant updates to your customers about the status of their packages. Increase the overall customer-to-brand shipping experience as well as create additional trust between the brand and consumer.
The first rollout of these new features will begin Q4 of 2022 and Q1 of 2023. We are excited to share with the brands and fulfillment centers we work with. Click here to join our Beta testers and be the first to know about new updates.
By utilizing IntelliRate and our shipping analytics dashboard, brands can optimize your business performance. All this data is presented to better help brands make decisions and exponentially grow their business. Measuring performance allows you to increase the capacity for success instead of making decisions blindly, use data to your advantage.
When presented with a shipping analysis use it to forecast future metrics such as sales, orders, international demand, etc. Using historical data and analytics you can sharpen your businesses trajectory to better meet consumers expectations. By understanding the data behind your sales, you will better understand the customer, their wants, needs, and timing.
If you would like more information about shipping analytics click here.

The supply chain is a term used to describe all the components required to transport goods from beginning to end, from production to the end...

A smart warehouse is a large building where raw materials and other consumer goods are stored using machines, computers, comprehensive software, and...

Direct-to-consumer (DTC) fulfillment is a strategy that helps brands sell and deliver their products directly to customers more efficiently while...
